Read a market's page
On this page
A market's page is where one question is shown in full. It has the odds for every answer, a chart of how they have moved with the news marked on the timeline, what traders have put behind it and the headlines about its subject.
#Open a market
Select a market's question anywhere it appears: on a card, in a list or table, in search results or in the Predictions box above ordinary search results. Its page opens on 4Search. The venue chip, by contrast, opens the market on the venue's own site.
#The top of the page
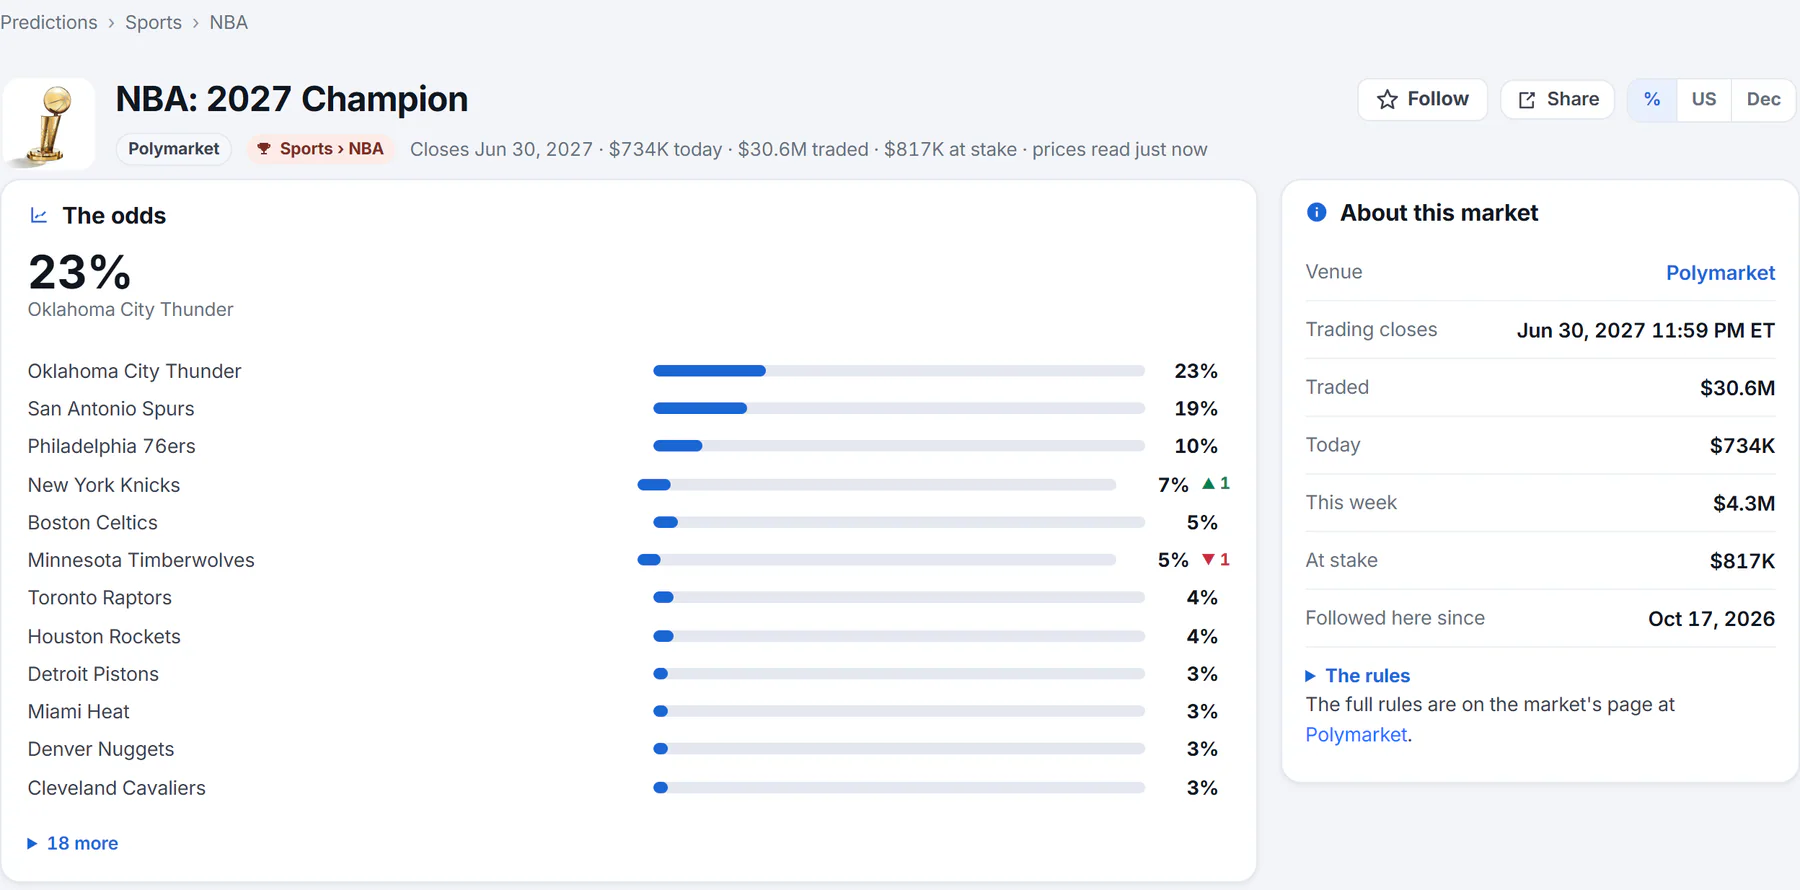
The top of a market's page. The odds card lists every answer; the more line at its foot unfolds the rest.
- 1The question
- 2Venue, topic, when it closes and the money
- 3Follow, Share and the odds format
- 4The odds for every answer
- 5About this market
- The question is the page's heading. A path above it, such as Predictions › Sports › NBA, takes you back to the topic.
- The line under it gives the venue, the topic, when the market closes and the money traded. Select the venue chip to open the market on the venue.
- The buttons at the right are Follow, Share and the odds format switch. Follow adds the market to your list; see Follow markets. Share copies the page's link, and on a device that has a share sheet it opens that instead. The %, US and Dec buttons change how chances are written; see Show odds as percentages, American odds or decimal odds.
- The odds card shows every answer's chance, as a bar for yes-or-no and one-of-many questions, or as a spread of prices for questions about a number. See How to read prediction market odds.
- About this market, on the right, lists the facts. See below.
#How the odds have moved
Under the odds, a chart draws each leading answer's chance over time, with the headlines about the market's subject marked along the bottom.
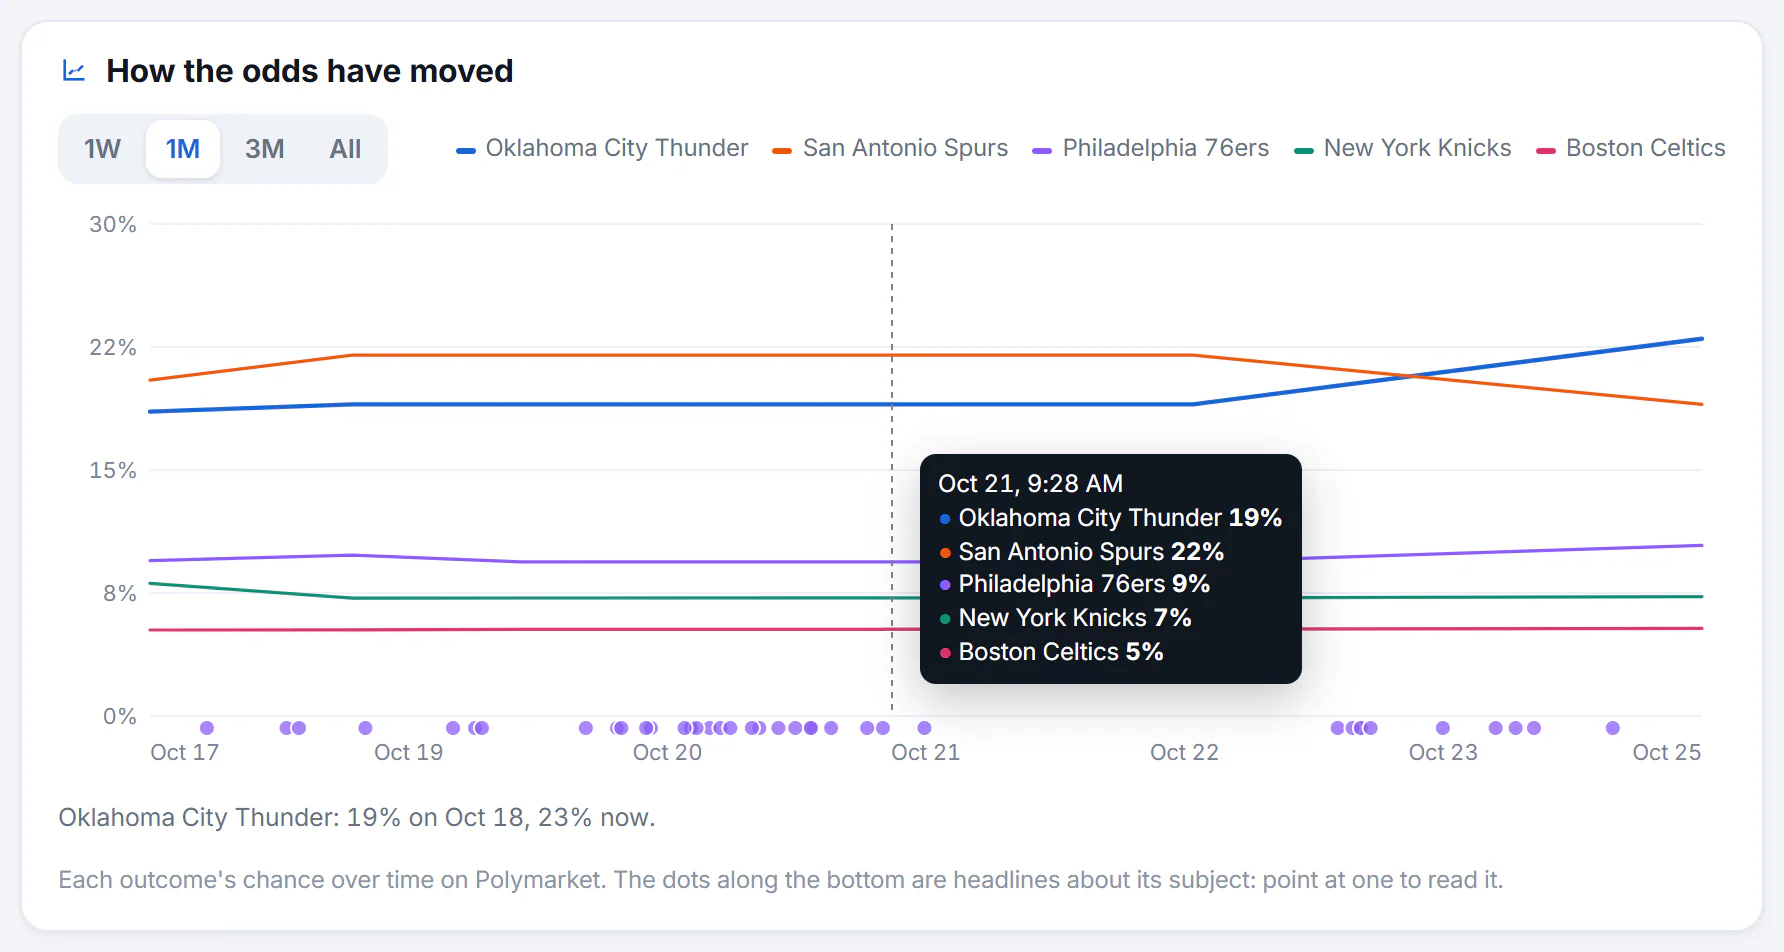
Point at the chart to read the numbers for a moment. The dark box lists each line's chance at that time.
- 1Choose a period
- 2Which line is which
- 3A dot is a headline about the subject
- 4Point at the chart to read a day's numbers
- 1W, 1M, 3M and All choose the period. An open market starts on one month, and a settled market on all of its history.
- The legend names each line. It appears when there is more than one.
- The dots along the bottom are headlines about the market's subject. Point at one to read the headline and its outlet, and select it to open the article in a new tab.
- Pointing at the chart draws a vertical line and a box with the date and each line's chance, written in the format you chose.
- A sentence under the chart sums it up, such as "Oklahoma City Thunder: 19% on Oct 18, 23% now".
For a question about a number, such as a price on a date, the chart draws the median over time and shades the middle half around it. If a market has appeared on Predictions recently, the chart says Not enough history yet.
#Why it moved
When a market has had big swings and there were headlines about its subject in the hours before them, a Why it moved box lists the biggest swings over the chart's period. Each shows when it happened, how far the chance moved and the headlines published shortly before.
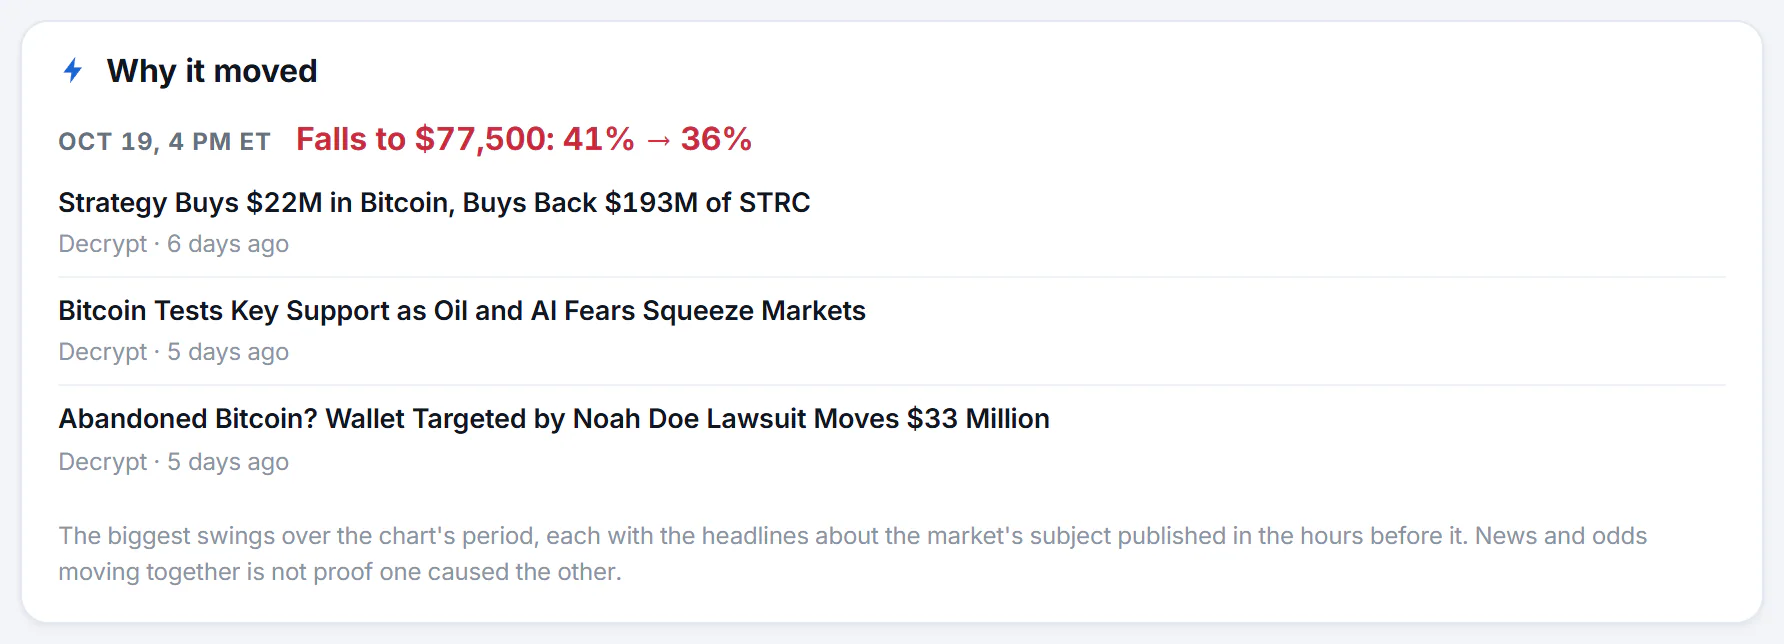
A swing, with the headlines from the hours before it.
- 1When the swing happened
- 2How far the chance moved
- 3Headlines from the hours before
- 4A reminder that timing is not proof
The box says it plainly: news and odds moving together is not proof that one caused the other. Treat it as context, not an explanation. Not every market has the box.
#Every outcome
The Every outcome table lists each answer's chance, its move today, the best bid and ask, what a dollar pays and how much traded. It is explained in How to read prediction market odds. Select a column heading to sort the table.
#The same question on other venues
When another venue asks the same question, a box named The same question on and the venue's name sits below the table, with the other venue's market and how far apart the two are. See The venues Predictions brings together and Compare venues.
#The news and related markets
- The news lists up to a dozen recent headlines that name the market's subject, with a Search link that runs the subject through Predictions. The heading names the subject, for example The news: recession.
- Related markets shows cards for nearby questions, with a link to every market in the topic.
#About this market
The box at the right lists:
| Row | What it says |
|---|---|
| Venue | The venue, with a link to the market there |
| Settles on | What the market settles on, where the venue says |
| Starts | When a game starts |
| Measured | When the figure the market is about is measured, if that is well before the close |
| Trading closes, Trading closed or Listed end | When trading ends, in Eastern time. A Polymarket market past its listed end shows Listed end and a note that it is still trading until the result is in |
| Traded, Today, This week, At stake | The money figures |
| In the news | How many headlines named the subject today and this week |
| Followed here since | The day Predictions first listed the market |
| The rules | A short version of the venue's rules; the venue has the full text |
Two more boxes may sit below it. Prices it is about lists the stocks, rates or coins the market is about, with their latest prices from 4Search Finance, which may be delayed up to 15 minutes. For an election market, The race links to the race on 4Search Politics.
#A market that has settled
When the venue has decided the result, the page opens on a Settled line, which says what happened and what traders gave it the day before. If the answer had under 30%, the line adds that it was an upset.
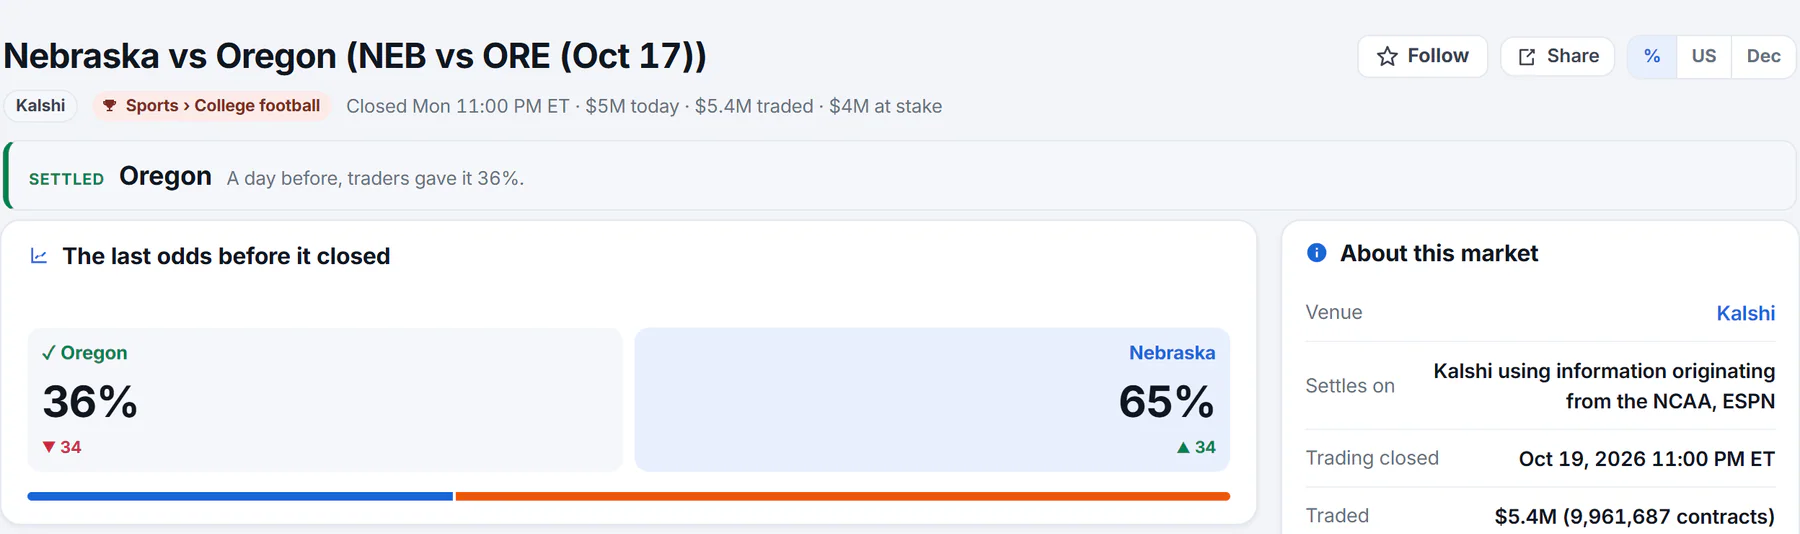
A settled market: the result, what traders expected a day earlier and the last odds before it closed.
- 1What it settled on, and what traders expected
- 2The last odds before it closed
The odds card is renamed The last odds before it closed, the Chance column reads Last odds, and a check mark and a cross show which outcomes happened. A market that has closed but not yet settled says Closed, awaiting its result.
#Common questions
Why does the chart say "Not enough history yet"?
Predictions has followed the market only briefly, so there are too few readings to draw. Try a longer period, or come back later.
Can I zoom in on the chart?
There is no zoom. Choose 1W, 1M, 3M or All, and point at the chart to read exact values.
What do the dots on the chart mean?
Each dot is a headline that names the market's subject, placed at the time it was published. A cluster of dots means a busy news period. See The news behind the odds.
Why can the same market appear in Finance or Politics too?
Each service keeps its own page for a market, with its own context. They show the same odds. See Prediction markets in Finance, Politics and search.